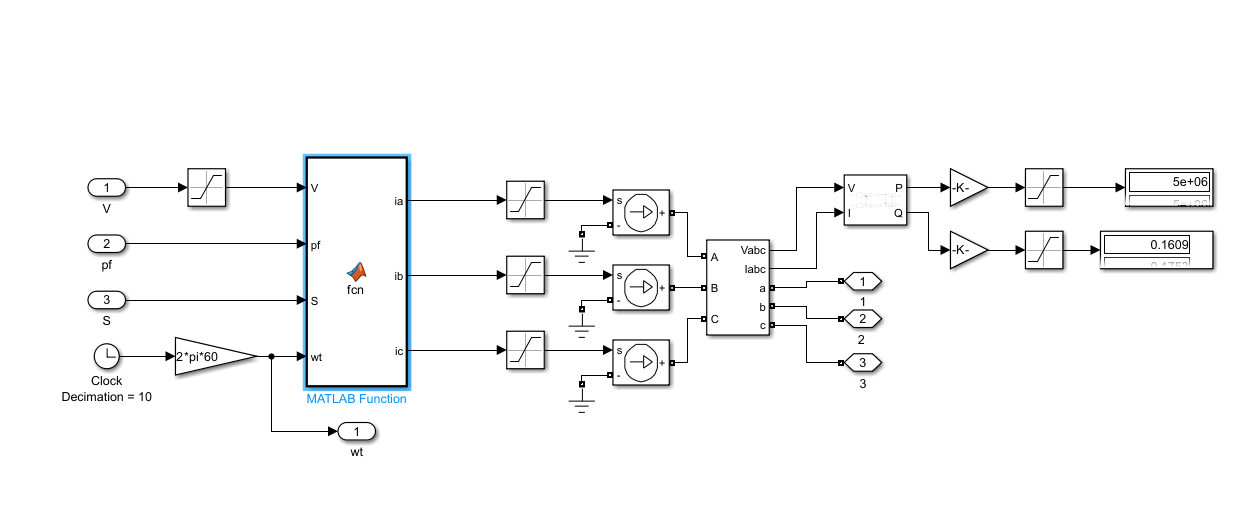
PV Subsystem
MATLAB Function block converts V, pf and S setpoints into three controlled phase currents injected at 25 kV, with positive-sequence P/Q measurement.
- 3 MVA
- 25 kV
- Unity pf
Case Study / Power Systems Simulation
A full electromagnetic-transient model of a 25 kV distribution feeder hosting solar generation, a heavy industrial motor, dynamic residential demand and a ten-bay EV fast charging depot — built in Simulink to quantify stability margins under worst-case switching.
02 / Architecture
A schematic block view of the network, alongside the actual top-level Simulink model it was built from.
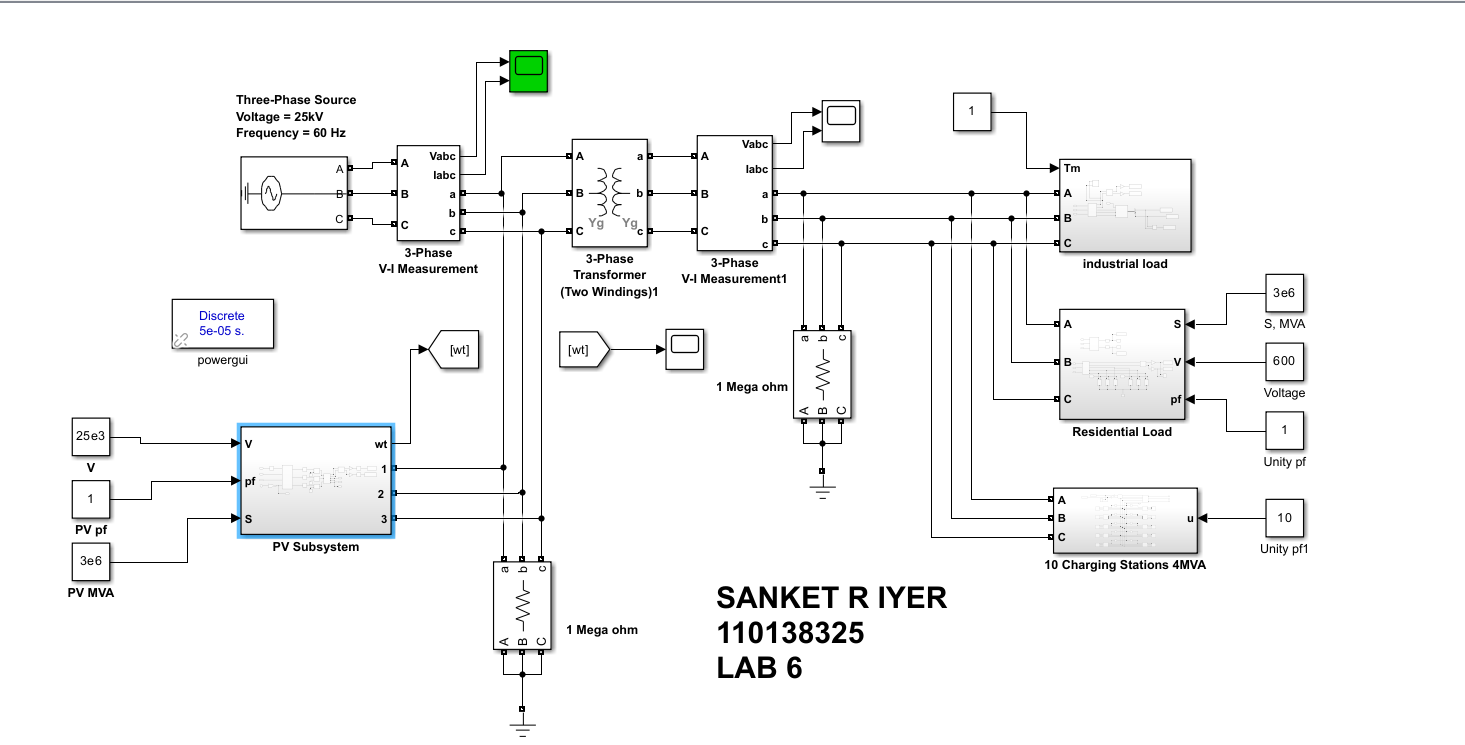
MATLAB Function block converts V, pf and S setpoints into three controlled phase currents injected at 25 kV, with positive-sequence P/Q measurement.
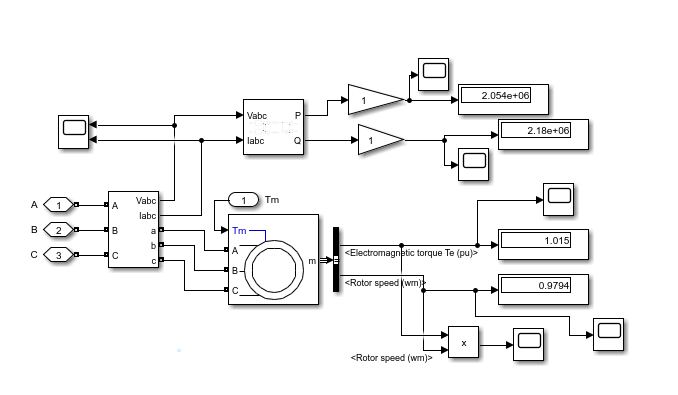
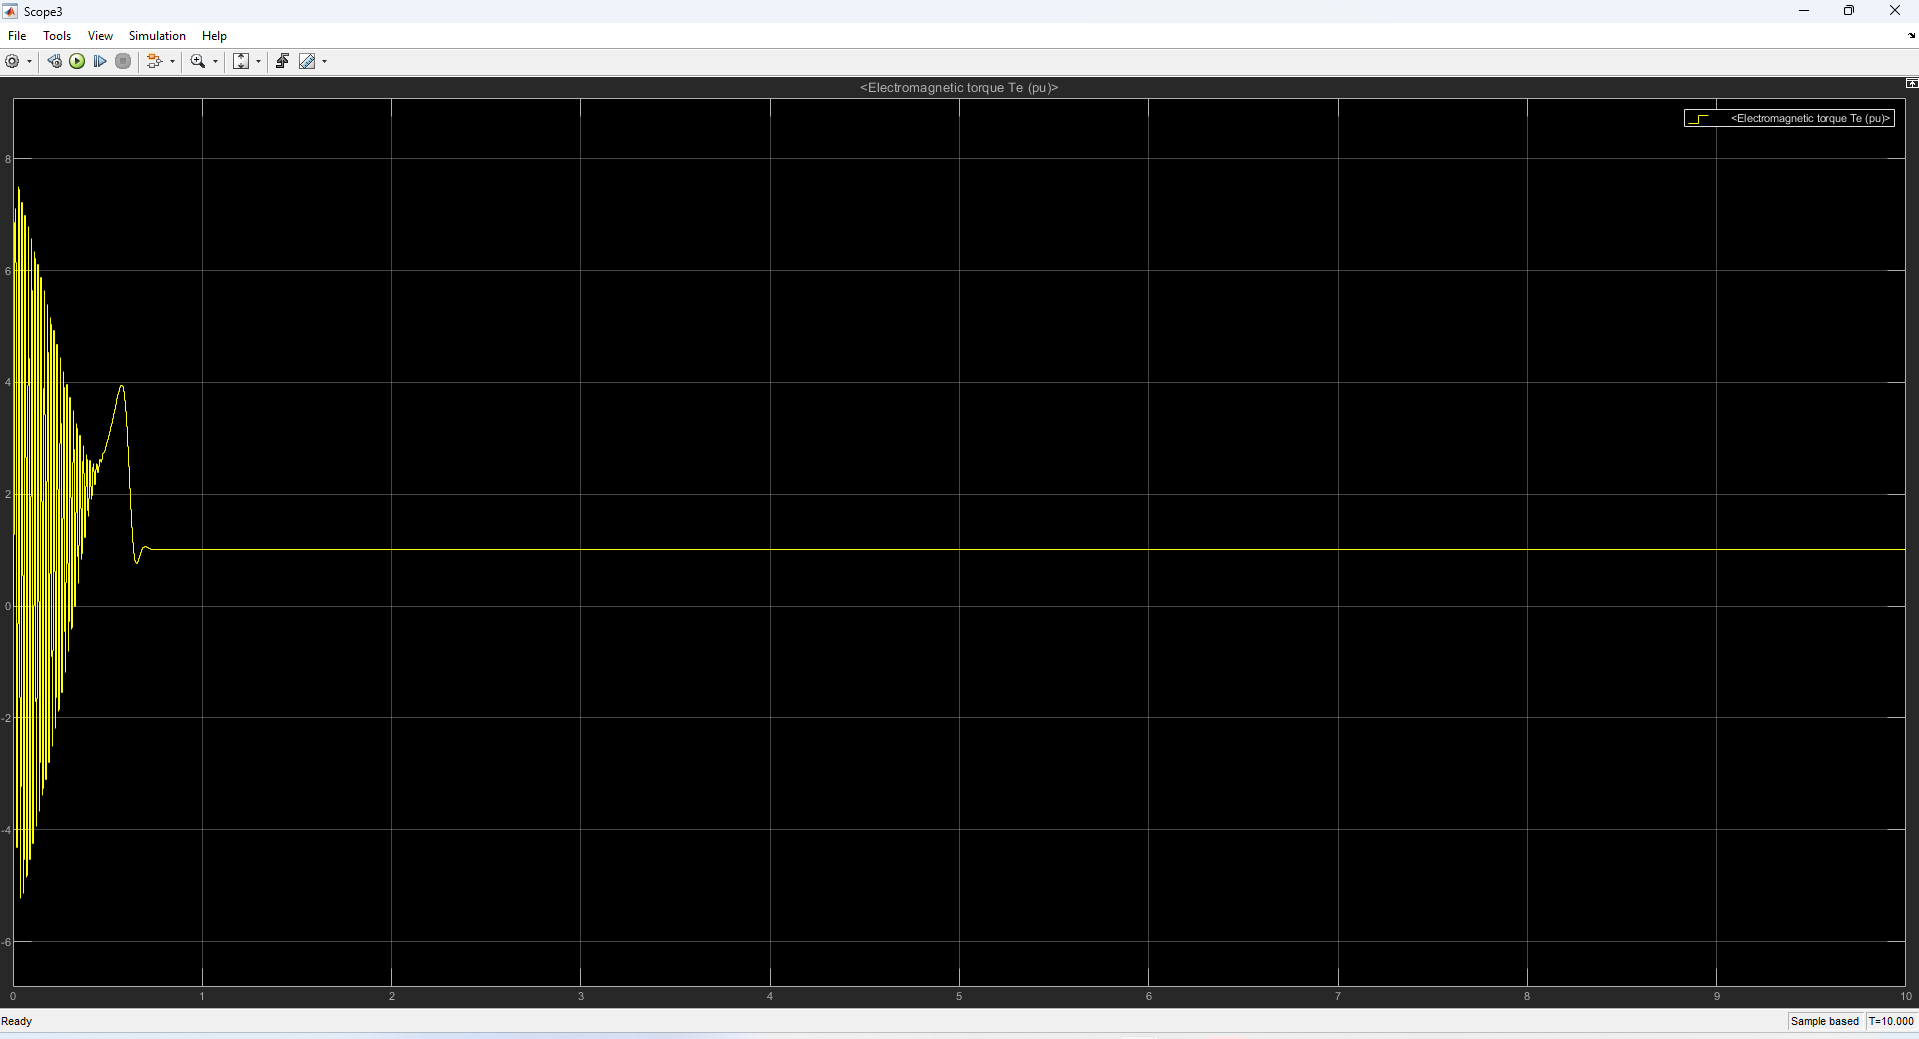
Asynchronous machine fed from the 630 V bus, instrumented for electromagnetic torque, rotor speed and input active/reactive power.
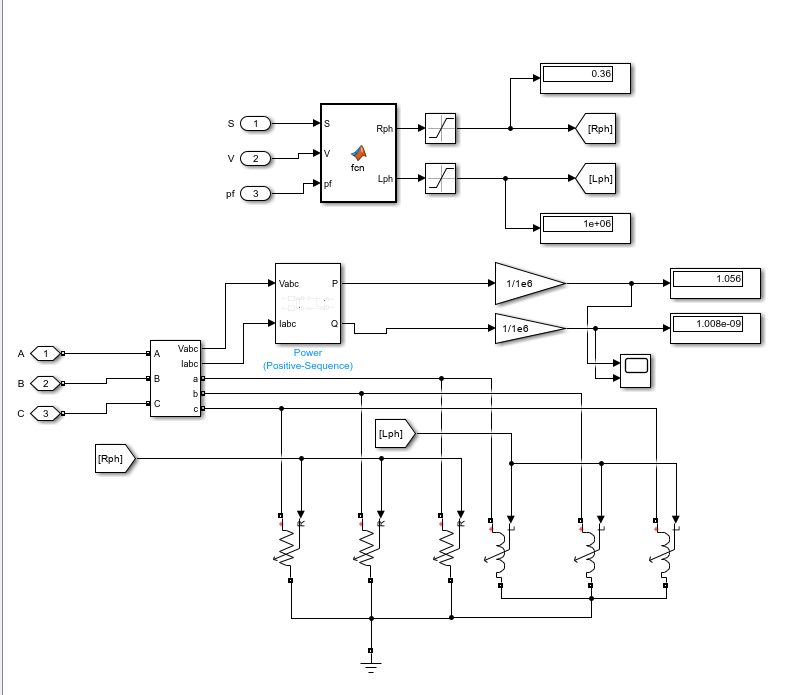
MATLAB Function derives per-phase R and L from S, V and pf, driving variable resistor and inductor branches for a dynamic demand profile.
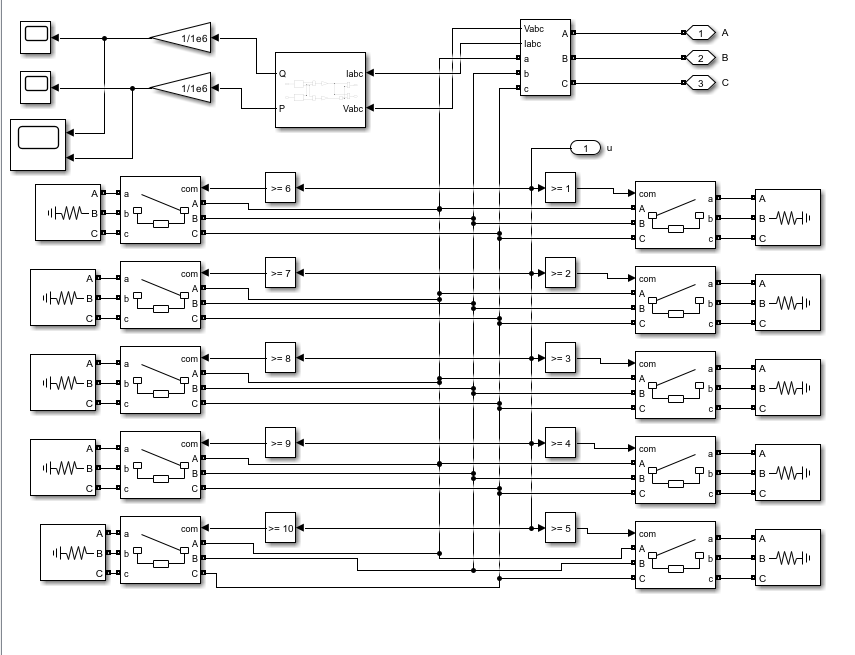
Ten breaker-switched RLC charging branches enabled in stages by a comparator bank driven by the occupancy input u.
03 / Parameters
Block-level ratings used across the Simscape Electrical network.
| Component | Rating | Voltage | Configuration | Notes |
|---|---|---|---|---|
| Three-Phase Source | Utility grid | 25 kV | 60 Hz, Yg | Point of common coupling upstream of the transformer |
| Three-Phase Transformer | 20 MVA | 25 kV / 630 V | Yg–Yg, two windings | Steps the feeder down to the 630 V distribution bus |
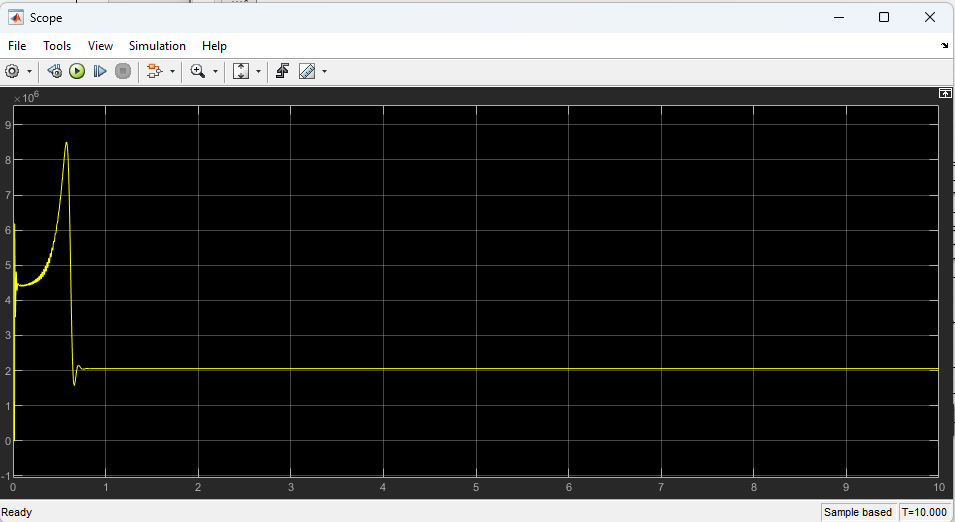
| Asynchronous Motor | 2 MVA | 600 V | Squirrel cage, Tm = 1 pu | 8.5 MW starting transient settling to 2.05 MW steady state |
| Residential Load | 3 MVA | 600 V | Variable R–L, unity pf | MATLAB Function computes Rph and Lph from S, V, pf |
| EV Charger Cluster | 4 MVA | 600 V | 10 stations, breaker switched | 3 MW → 4.2 MW step as stations come online |
| Solver | powergui | — | Discrete, Ts = 5e-05 s | 10 s simulation window |
04 / Results
Each tab pairs an annotated reconstruction of the logged signals with the raw Simulink scope captures from the 10 s run.
05 / Findings
What the study established about hosting large EV infrastructure on an existing feeder.
With the 20 MVA transformer in place, feeder voltage stayed balanced through motor starting and every charger switching event, confirming the 4 MVA depot can be hosted without reinforcement.
PV injection and residential demand are generated by MATLAB Function blocks that convert S, V and pf setpoints into currents or variable R–L branches, so scenarios can be swept without rewiring the network.
The 8.5 MW motor inrush and ±5 pu torque swing decay within ~0.7 s; staging the ten chargers behind comparator-driven breakers keeps the 3 MW → 4.2 MW step clean and oscillation-free.