Case Study / Energy Storage & BMS
OCV–SOC Battery Modelling for EV State-of-Charge Estimation
A MATLAB/Simulink battery framework that maps open-circuit voltage to state of charge, then drives the pack with real EPA velocity schedules to quantify current demand, SOC depletion, energy consumption and achievable range across two cell formats.
- MATLAB
- Simulink
- OCV–SOC Mapping
- EV Drive Cycles
- Battery Modelling
- Peak power
- ≈80 kW
- Drive cycles
- UDDS · US06
- Packs compared
- 2170 / 4680
- Start SOC
- 80 %
02 / Method
Modelling workflow
From road-load physics to a coulomb-counted SOC trace validated against the OCV–SOC curve.
01 — Road-load demand
Vehicle power P(t) is assembled from grade, rolling resistance, aerodynamic drag and inertia terms evaluated against the EPA velocity trace at 1 Hz.
P = (m·g·sinθ + cr·m·g·cosθ + ½ρ·cd·Af·v² + m·a)·v02 — Pack current
Demand is divided by the series pack voltage to obtain instantaneous pack current, the input to both the OCV–SOC lookup and coulomb counting.
I = P / (S · Vcell)03 — SOC estimation
SOC is integrated from the pack current and cross-checked against the OCV–SOC characterisation so terminal voltage and estimated charge stay consistent.
s(t) = s₀ − (1/Qpack)·∫I dt / 3600
03 / Parameters
Vehicle & pack parameters
Two cell formats sized to near-identical vehicle mass so the comparison isolates chemistry and packaging.
| Glider mass | 1300 kg | Vehicle without pack |
|---|---|---|
| Rolling resistance cr | 0.013 | Constant, level road (θ = 0°) |
| Frontal area Af | 2.65 m² | Aerodynamic drag term |
| Drag coefficient cd | 0.23 | Air density ρ = 1.2 kg/m³ |
| Drivetrain efficiency η | 0.80 | Applied to both traction and regen |
| Auxiliary factor ca | 0.12 | Accessory / thermal overhead |
| Initial SOC s₀ | 0.80 | Coulomb counting start point |
| Parameter | Tesla 2170 | Tesla 4680 |
|---|---|---|
| Configuration | 96S 46P | 92S 9P |
| Cell voltage | 3.65 V | 3.6 V |
| Cell capacity | 4.6 Ah | 22 Ah |
| Pack voltage | 350.4 V | 331.2 V |
| Pack capacity | 211.6 Ah | 198.0 Ah |
| Pack energy | 74.1 kWh | 65.6 kWh |
| Pack weight | 68.6 kg | 358 kg |
| Vehicle total | 1590 kg | 1596 kg |
04 / Results
Drive-cycle simulation gallery
Switch cycle and pack to compare duty-cycle power, pack current and SOC depletion computed from the same road-load model.
Velocity trace — UDDS — urban
- v(t) (m/s)
Duty-cycle power — Tesla 2170
- P(t) (kW)
Pack current — Tesla 2170
- I(t) (A)
State of charge — Tesla 2170
- SOC (fraction)
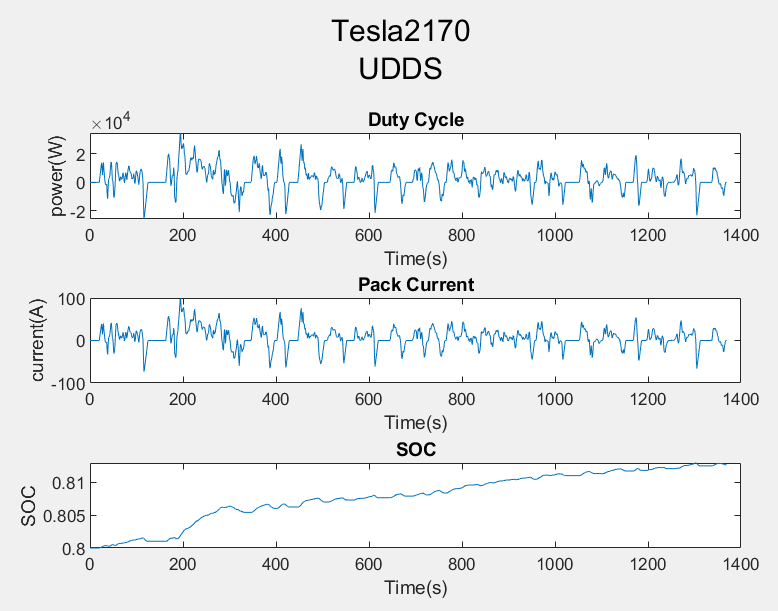
| Pack | Pack energy | Peak power | Peak current | Final SOC | Consumption | Est. range | MATLAB range |
|---|---|---|---|---|---|---|---|
| Tesla 2170 | 74.1 kWh | 37 kW | 106 A | 0.795 | 461 Wh/km | 161 km | 325.2132 km |
| Tesla 4680 | 65.6 kWh | 37 kW | 113 A | 0.794 | 463 Wh/km | 142 km | 286.5945 km |
05 / Findings
Key takeaways
What the study established about SOC estimation and pack sizing for electric vehicles.
OCV–SOC characterisation
Mapping open-circuit voltage to state of charge anchors the coulomb-counting integrator, keeping the estimate from drifting as current is integrated across a full cycle.
Drive-cycle sensitivity
US06 highway driving pushes traction demand to roughly 80 kW and depletes charge far faster than urban UDDS operation, where regenerative braking recovers a meaningful share of the energy.
Pack design trade-offs
The 96S46P 2170 and 92S9P 4680 packs land at near-identical vehicle mass but differ in usable energy and current loading, directly shifting Wh/km and achievable range.